Harness your organization's detailed labor data to generate actionable analytics and insights to improve management activities, from increasing productivity to reducing labor costs.
Build a common analytical culture with democratized insights available as reports and analytics on a desktop, tablet, or mobile device.
RENOVA Analytics offers open integration, working with external data sources to create connected experiences and a frictionless path to action. Our analytics software uses RENOVA HCM Suite data source to connect users and processes to the information they need to analyze and act on data and become proactive and contribute to company growth.
Move towards a better understanding of what's driving performance and use our HR analytics software to:
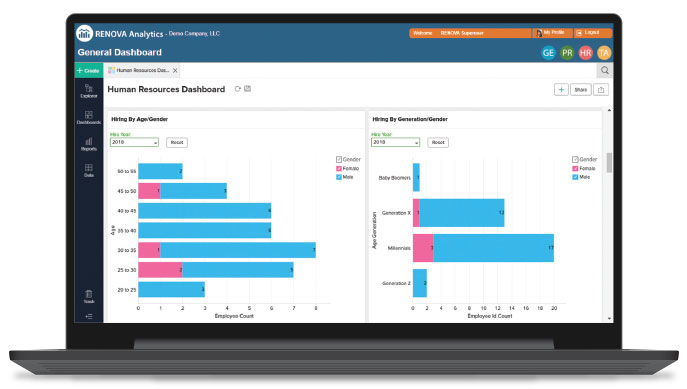
Metrics Visualization
Identify areas of improvement at-a-glance with our rich set of real-time labor metrics:
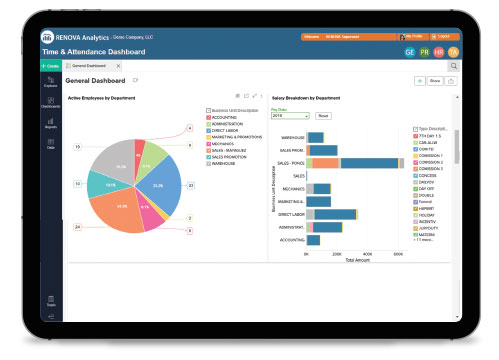
deviations between the breakdown of labor by pay code,
potential abuse of attendance policies,
time and cost to hire,
retention and turnover rates,
skills gaps,
top performers,
signs of disengagement.
Visualize costs impact with easily accessible critical insights on any device.
Get automatic data visibility and powerful inline data preparation and visual data flow from anywhere, on any device, whether you load it from RENOVA data or through an operational database.
Scalable environment prepared to support varied user requirements.
Choose visualization formats.
Industry Standard People Analytics
Create customizable reports that are filterable by a broad range of criteria such as:
active employees,
tenure,
reporting level,
organizational group,
generation,
all the data available in the employee,
electronic record.
Run correlations, regressions, pivot tables, cluster analysis, and advanced crosstabs.
Ad Hoc Reporting
Allow non-technical business users access to these most precious insights.
Create one-time or stand-alone reports for a particular purpose or business necessity and add an extra layer of substance and success to the data-driven decision-making process.
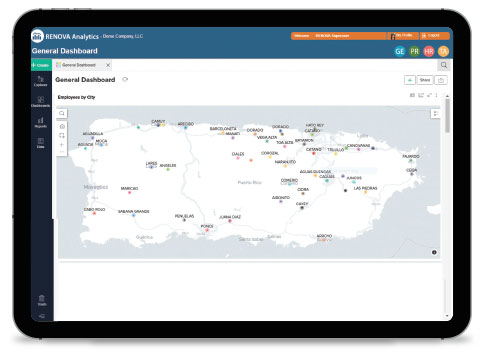
Demographics maps
Spot critical trends in your data with demographic overlays of your data.
Easily segment your data and access location-specific information related to gender, race, age, education, and other metrics that will configure a more thorough profile of your people.
We use cookies on our website to give you the most relevant experience by remembering your preferences and repeat visits. By clicking “Accept”, you consent to the use of ALL the cookies.
This website uses cookies to improve your experience while you navigate through the website. Out of these cookies, the cookies that are categorized as necessary are stored on your browser as they are essential for the working of basic functionalities of the website. We also use third-party cookies that help us analyze and understand how you use this website. These cookies will be stored in your browser only with your consent. You also have the option to opt-out of these cookies. But opting out of some of these cookies may have an effect on your browsing experience.
Necessary cookies are absolutely essential for the website to function properly. This category only includes cookies that ensures basic functionalities and security features of the website. These cookies do not store any personal information.
Any cookies that may not be particularly necessary for the website to function and is used specifically to collect user personal data via analytics, ads, other embedded contents are termed as non-necessary cookies. It is mandatory to procure user consent prior to running these cookies on your website.
FOLLOW US: